Statistics shows where your money went over any period, and can turn it into a PDF statement.
Open Statistics
On Home, tap Explore on the Statistics card. Choose a period along the top: This month, Last month, Last 3 months, This year, or a Custom range.
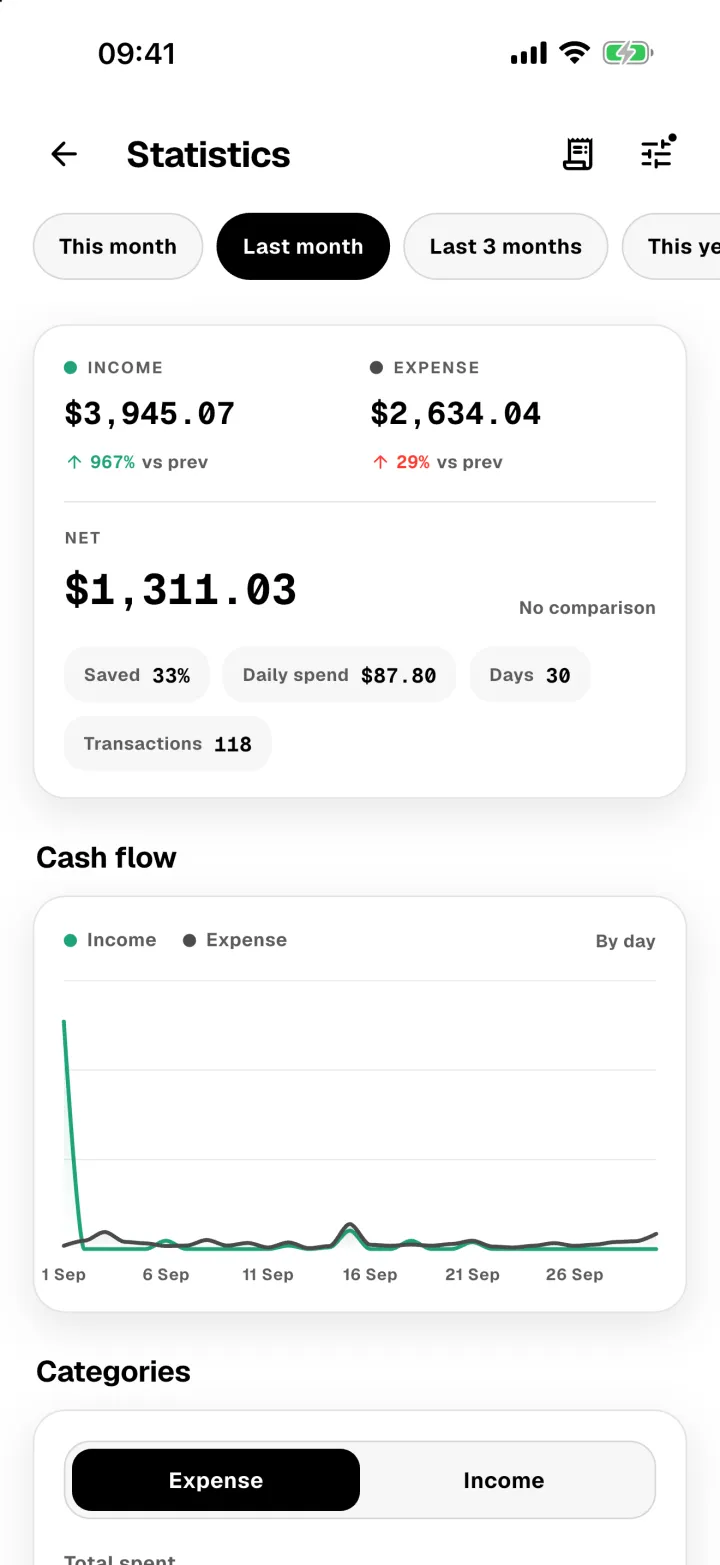
The top card shows income, expenses and what's left, each compared with the period before. Below it, Cash flow charts money in and out over time.
Where it went
Categories splits your spending, or your income, by category, with an amount and number of transactions for each.
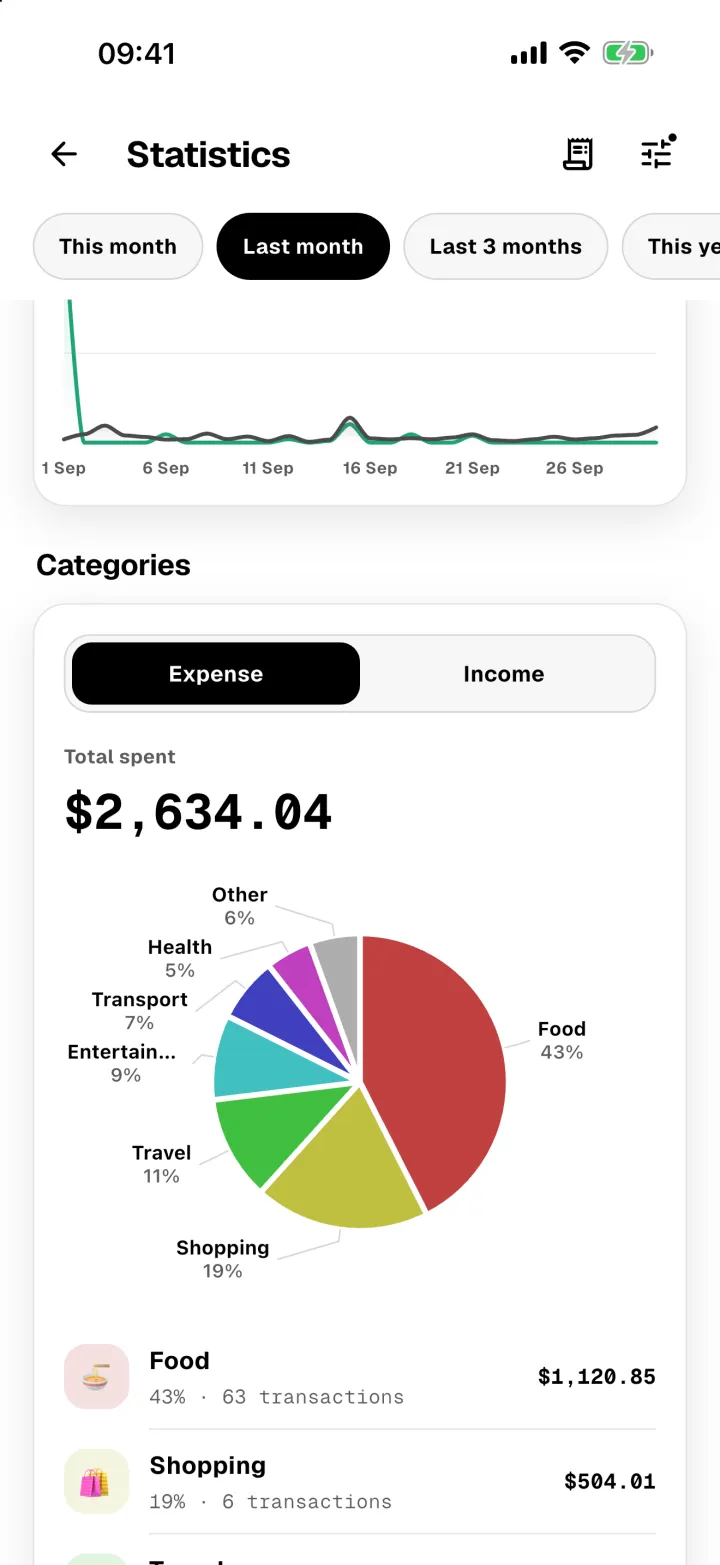
Further down you'll find which days of the week you spend most, and your biggest expenses.
Balance sheet and PDF statement
Tap the statement icon at the top to see your balance sheet: what you have, what you owe, and how each wallet changed over the period.
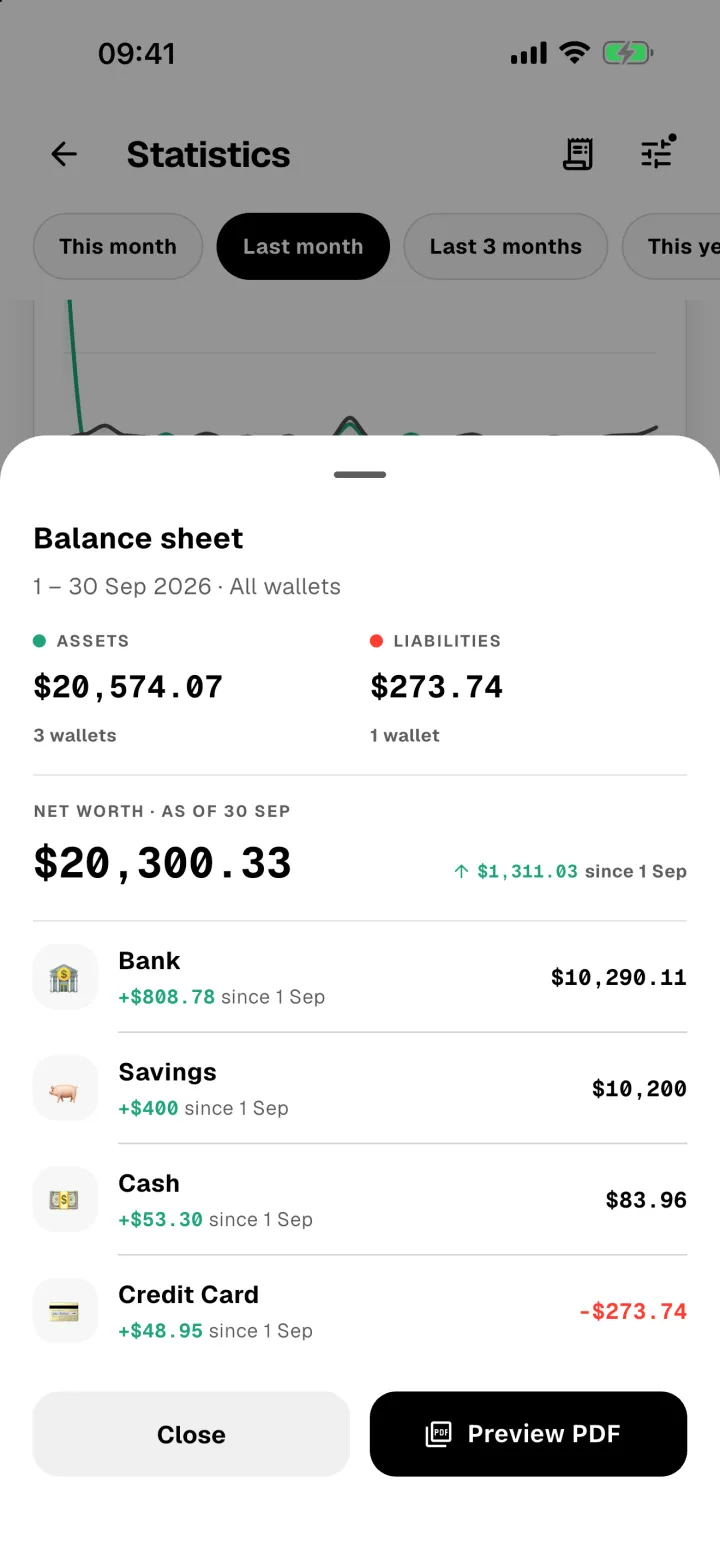
Tap Preview PDF to build a statement for exactly what you're looking at. Check it page by page, then tap Share PDF to save it or send it on.
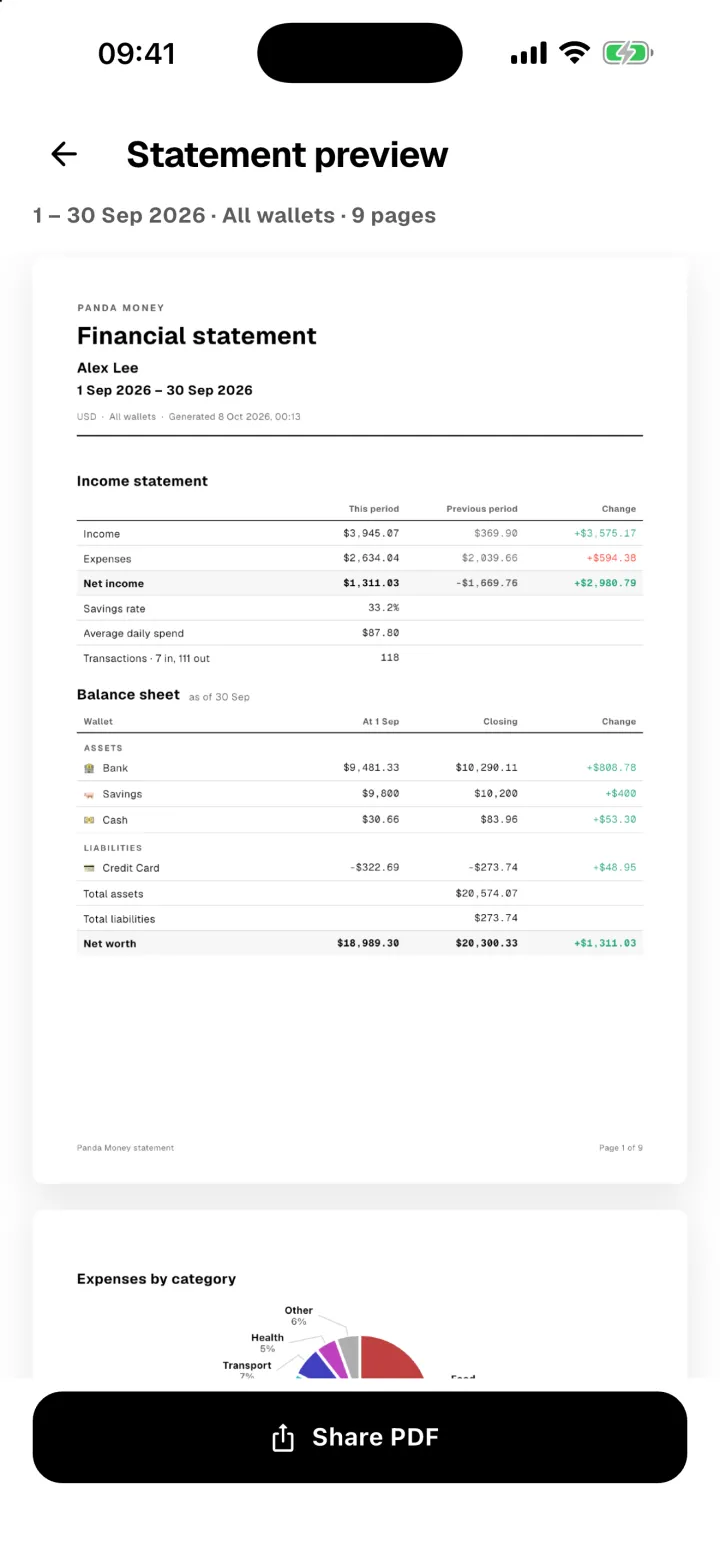
The statement includes your income and spending, the balance sheet, category charts, your biggest expenses, and a list of every transaction with a running balance, like a bank statement.